Maps, Apps and Scripts
Maps
-
1. Gone Hikin’
This project was concluded as a keystone project in the final year at SAIT.
-
1.1 Study Area Overview
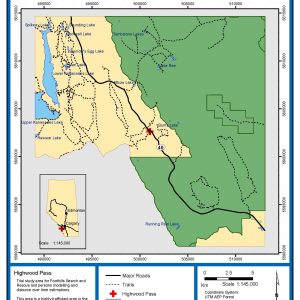
Study Area Overview of the Main Project in Kananaskis AB.
-
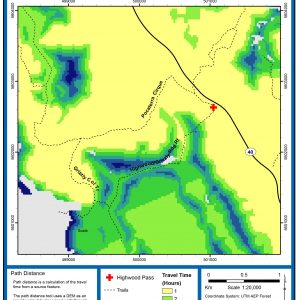
1.2 Path Distance Analysis
Path Distance Analysis within the Kananaskis, High Pass Area. This is a demonstration of Path Distance Analysis.
-
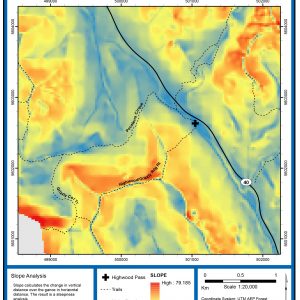
1.3 Slope Analysis
Slope Analysis within the Kananaskis, High Pass Area. This is a demonstration of Slope Analysis.
-
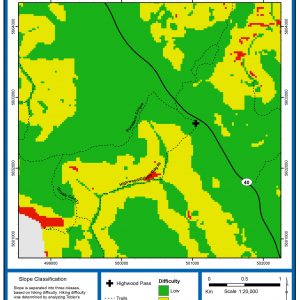
1.3 Slope Analysis Classified
Slope Analysis within the Kananaskis, High Pass Area. This is a demonstration of Slope Analysis Classified.
-
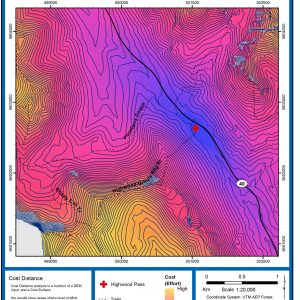
1.4 Cost Distance
Cost Distance Analysis within the Kananaskis, High Pass Area. This is a demonstration of Cost Distance Analysis.
-
2. Map Rendering in 3D
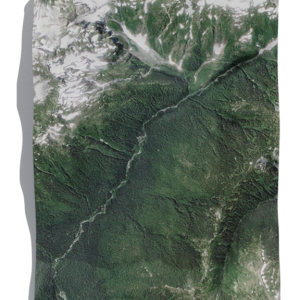
This map was created with the use of a variety of software. Blender and ArcMap were the primary software used on this map.
-
3. Merico Drug Crime
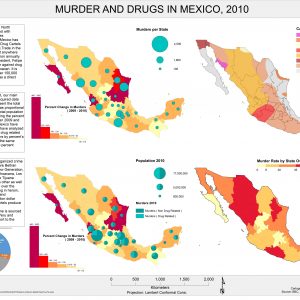
This map illustrated a relationship between he murders and the drugs within he country of Mexico.
-
3.0 Neighbourhoods in Wetaskiwin
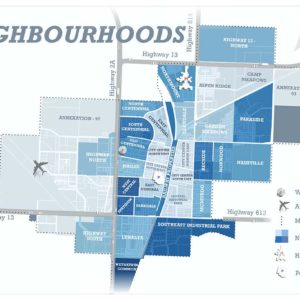
This map was created in QGIS and inkscape. On open-source codes.
-
4. Correlation and Regression
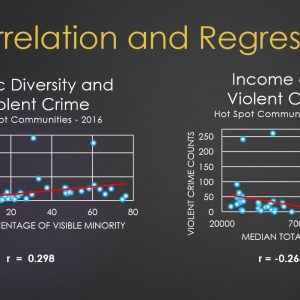
Correlation and regression representation of the ethical diversity and violet crime as well as income and violent crime.
-
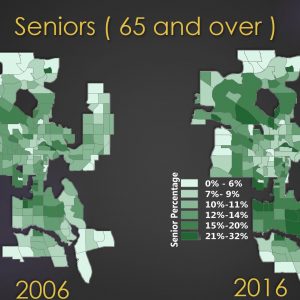
4.1 Seniors above 65 years of age
Population growth of the senior population within the City of Calgary between the year 2006 and 2016.
-
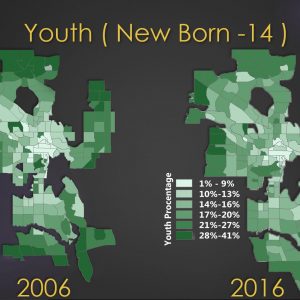
4.2 Youth from new born to 14 years of age
Population growth of the youth population within the neighborhoods of the City of Calgary between the year 2006 and 2016.
-
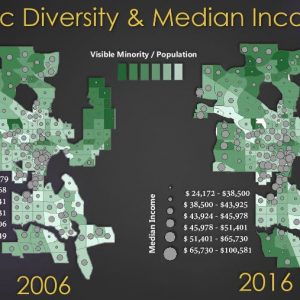
4.3 Ethnical Diversity and Medical Income
Population growth of the ethnical diversity and medical income within the neighborhoods of the City of Calgary between the year 2006 and 2016.
-
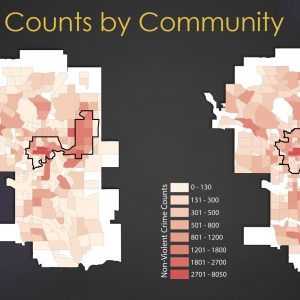
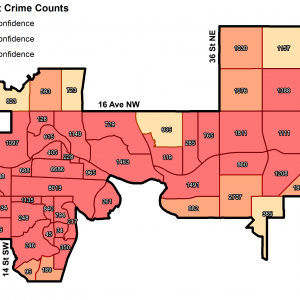
4.4. Crime Counts by Community
Violent Crime Counts vs Non-Violent Crime Counts
-
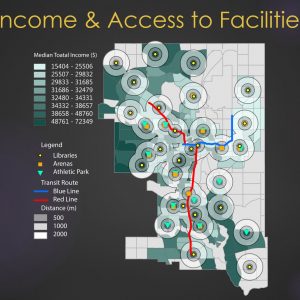
4.5 Income and Access to Facilities
Income and Access to Facilities within the City of Calgary.
-
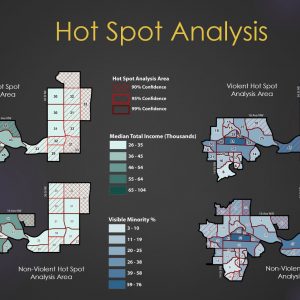
4.6 Hot Spot Analysis
Hot Spot Analysis within the City of Calgary.
-
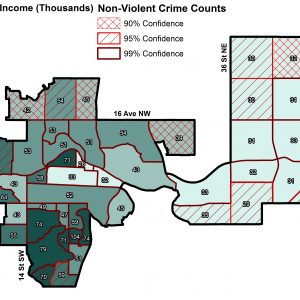
4.7 Non Violent Hotspot vs Income
Median total Income (Thousands) Non-Violent crime Counts.
-
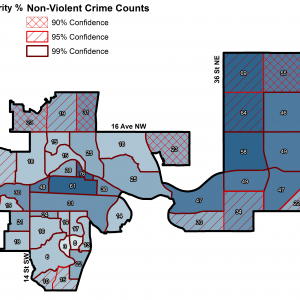
4.8 Visible Minority % Non-Violent Crime Counts
Visible minority % non-violent crime counts within the City of Calgary.
-
4.9 Non-Violent Crime Counts
Non-violent crime counts within the City of Calgary.
-
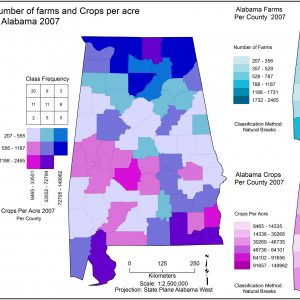
5. Farm Development Alabama
Farm Development Alabama 2207 Selected Indicators. Number of farms and Crops per acre in Alabama 2007. Alabama Farms Per County 2007. Alabama Crops Per County 2007.
-
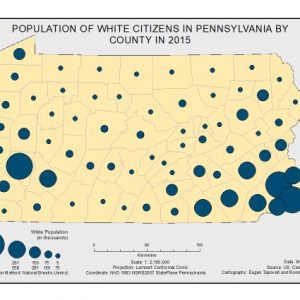
6. Population of white citizens in Pennsylvania by County in 2015.
Population of white citizens in Pennsylvania by County in 2015.
-
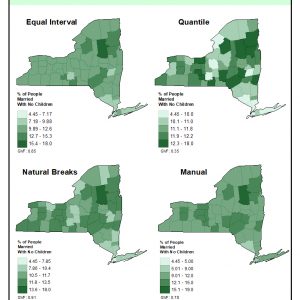
7. Percentage of People Married with No Children
Percentage of People Married with No Children in the New York State in 2017. Comparison of Data Classification methods.
-
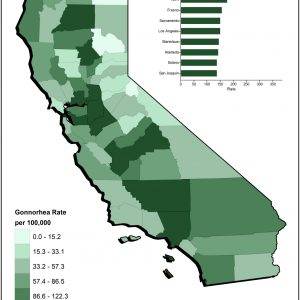
8. California Gonorrhea.
California Gonorrhea Rate Per 100,000 People in 2014. 10 Highest County Gonorrhea Rates in California.
Applications
Automated script created with Microsoft Flow, Microsoft Excel and Surveys 123.
Application created in dashboard, ArcMap and ArcGIS online. This application was a project for the Search and Rescue crew in Alberta.
Scripts
